Latin America Championship 2026 — Editor Usage Report (normalized by region)
Table of Contents
- 1. Metric, inclusion rule, and interpretation
- 2. Regions
- 3. Teams per region
- 4. Overall editor adoption (all teams)
- 5. Regional adoption (normalized within each region)
- 6. “Which regions use each editor the most?” (adoption perspective)
- 7. Top-10 teams (by standing): most used editors (adoption)
- 8. Top team of each country: editors used (>= 60 minutes open)
- 9. General (non-causal) summary
- 10. CCL (Café Com Leite) invited teams (separate analysis)
- 11. Machines used by teams
SCORE | RUNS | TASKS | CLARIFICATIONS | STATISTICS
1. Metric, inclusion rule, and interpretation
- Contest duration: 5 hours = 300 minutes.
- Usage criterion (this report): an editor is considered used by a team if it remained open for at least 60 minutes.
- Interpretation: within the 300-minute window, a higher “open time” suggests stronger evidence the editor was used; however, this report focuses on adoption (how many teams used each editor), not on minutes.
- Important: this report does not relate editor choice to final ranking.
2. Regions
| Region code | Meaning |
|---|---|
| MX | Mexico |
| CB | Caribbean |
| CA | Central America |
| BR | Brazil |
| NO | South America North |
| SO | South America South |
3. Teams per region
Counts below come from the provided standings list (41 teams total).
| Region | Teams |
|---|---|
| SO | 14 |
| BR | 12 |
| MX | 6 |
| CB | 4 |
| CA | 3 |
| NO | 2 |
| Total | 41 |
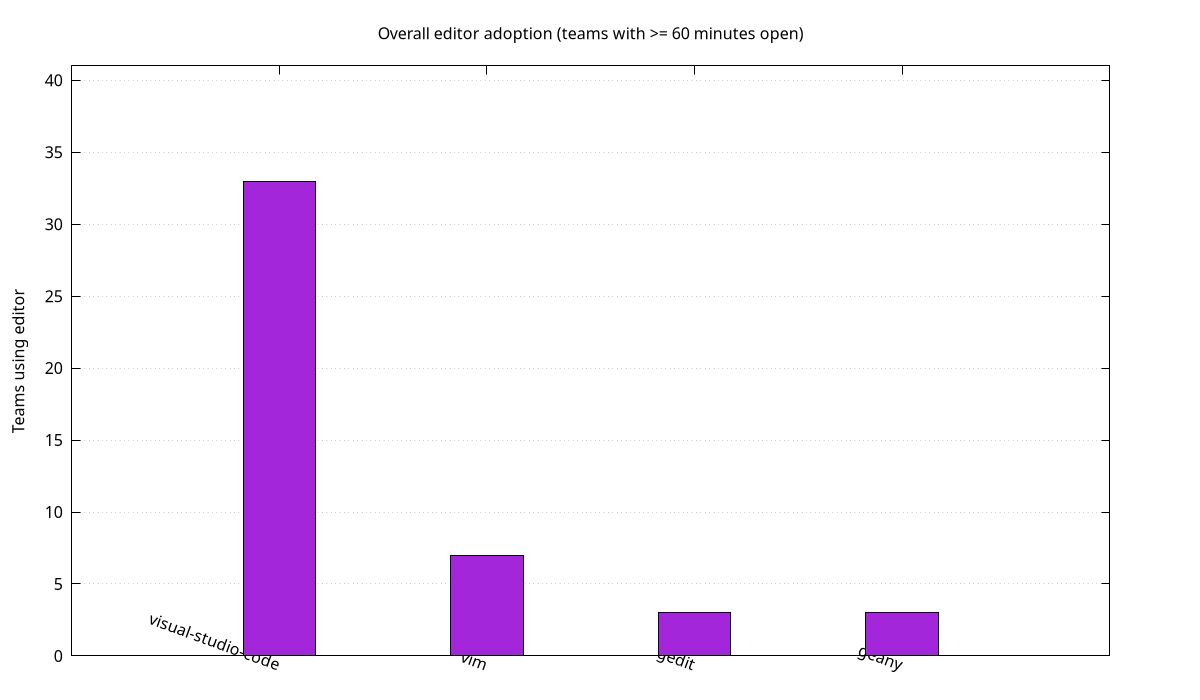
4. Overall editor adoption (all teams)
(Unique teams that used each editor for >= 60 minutes. A team may use multiple editors.)
| Editor | Teams using | Share of all teams |
|---|---|---|
| visual-studio-code | 33 | 80.5% |
| vim | 7 | 17.1% |
| gedit | 3 | 7.3% |
| geany | 3 | 7.3% |
| emacs | 2 | 4.9% |
| intellij-pycharm | 2 | 4.9% |
| intellij-clion | 1 | 2.4% |
4.1. Chart (overall adoption by teams)
5. Regional adoption (normalized within each region)
Percentages are computed as:
(# teams in the region that used the editor) / (total teams in the region)
5.1. Adoption matrix (teams and % of region)
| Region | Teams | VS Code | Vim | Gedit | Geany | Emacs | PyCharm | CLion |
|---|---|---|---|---|---|---|---|---|
| MX | 6 | 6 (100.0%) | 0 (0.0%) | 0 (0.0%) | 0 (0.0%) | 0 (0.0%) | 0 (0.0%) | 0 (0.0%) |
| BR | 12 | 8 (66.7%) | 6 (50.0%) | 1 (8.3%) | 0 (0.0%) | 0 (0.0%) | 0 (0.0%) | 0 (0.0%) |
| NO | 2 | 2 (100.0%) | 0 (0.0%) | 1 (50.0%) | 0 (0.0%) | 0 (0.0%) | 0 (0.0%) | 1 (50.0%) |
| SO | 14 | 11 (78.6%) | 1 (7.1%) | 0 (0.0%) | 2 (14.3%) | 1 (7.1%) | 0 (0.0%) | 0 (0.0%) |
| CA | 3 | 3 (100.0%) | 0 (0.0%) | 0 (0.0%) | 0 (0.0%) | 1 (33.3%) | 0 (0.0%) | 0 (0.0%) |
| CB | 4 | 3 (75.0%) | 0 (0.0%) | 1 (25.0%) | 1 (25.0%) | 0 (0.0%) | 2 (50.0%) | 0 (0.0%) |
6. “Which regions use each editor the most?” (adoption perspective)
Because regions have different numbers of teams, this section highlights adoption rate (percentage), and also notes absolute leader when useful.
| Editor | Highest adoption rate (region) | Rate | Highest absolute count (region) | Teams |
|---|---|---|---|---|
| visual-studio-code | MX / NO / CA (tie) | 100% | SO | 11 |
| vim | BR | 50% | BR | 6 |
| gedit | NO | 50% | BR / NO / CB (tie) | 1 |
| geany | CB | 25% | SO | 2 |
| emacs | CA | 33.3% | CA / SO (tie) | 1 |
| intellij-pycharm | CB | 50% | CB | 2 |
| intellij-clion | NO | 50% | NO | 1 |
7. Top-10 teams (by standing): most used editors (adoption)
Top-10 teams are ranks 1..10 in the provided standings. Counts below indicate how many of the Top-10 teams used each editor (>= 60 minutes open).
| Editor | Top-10 teams using | Share of Top-10 |
|---|---|---|
| visual-studio-code | 6 | 60% |
| vim | 4 | 40% |
| gedit | 1 | 10% |
| geany | 1 | 10% |
| emacs | 0 | 0% |
| intellij-pycharm | 0 | 0% |
| intellij-clion | 0 | 0% |
8. Top team of each country: editors used (>= 60 minutes open)
(Reported descriptively only; minutes shown just as the recorded open-time evidence.)
| Country | Top team (rank) | Login | Editors used |
|---|---|---|---|
| BR | #1 | teambrbr030 | vim (262) |
| MX | #2 | teammxmx040 | visual-studio-code (316) |
| AR | #3 | teamsoar012 | visual-studio-code (316) |
| CL | #4 | teamsocl037 | vim (256) |
| PE | #9 | teamsope036 | visual-studio-code (317) |
| CO | #12 | teamnoco034 | visual-studio-code (317) |
| BO | #24 | teamsobo043 | visual-studio-code (316) |
| CU | #26 | teamcbcu026 | visual-studio-code (316) |
| UY | #31 | teamsouy031 | visual-studio-code (317) |
| CR | #35 | teamcacr029 | visual-studio-code (317) |
| DO | #37 | teamcbdo033 | gedit (326); visual-studio-code (316) |
| SV | #38 | teamcasv039 | visual-studio-code (316) |
| GT | #39 | teamcagt006 | emacs (246); visual-studio-code (316) |
| PR | #40 | teamcbpr044 | intellij-pycharm (315) |
| AG | #41 | teamcbag013 | geany (100); intellij-pycharm (199); visual-studio-code (299) |
9. General (non-causal) summary
- VS Code is the most widely adopted editor overall (33 out of 41 teams) and leads adoption in every region by count.
- Regional patterns by adoption (normalized):
- BR shows meaningful secondary adoption of Vim (50% of BR teams).
- CB is the only region with PyCharm adoption (50% of CB teams).
- NO is the only region with CLion adoption (50% of NO teams; small sample size: 2 teams).
- SO shows broader variety beyond VS Code (Geany and Emacs appear, plus some Vim).
10. CCL (Café Com Leite) invited teams (separate analysis)
CCL teams are invited teams and do not participate in the official competition. Therefore:
- They are excluded from the region/country breakdowns.
- They have no region/country inferred from the login (teams may mix coaches from different places).
- The same usage criterion applies: an editor counts as used if it stayed open for >= 60 minutes.
10.1. Coverage
From the provided CCL standings, there are 11 CCL teams:
teamccl001,teamccl002,teamccl003,teamccl004,teamccl005,teamccl006,teamccl007,teamccl008,teamccl009,teamccl010,teamccl012
All editor logs provided for CCL teams meet the >= 60 minutes criterion.
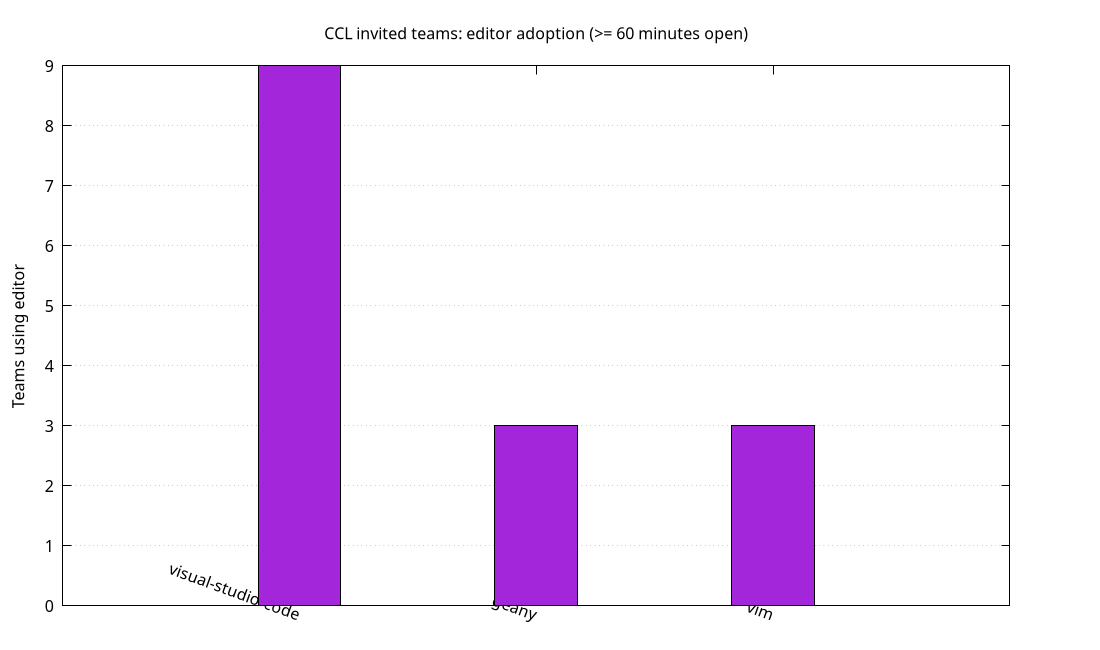
10.2. Editor adoption among CCL teams (teams using each editor)
(Unique teams using each editor for >= 60 minutes; teams may use multiple editors.)
| Editor | Teams using | Share of CCL teams (n=11) |
|---|---|---|
| visual-studio-code | 9 | 81.8% |
| geany | 3 | 27.3% |
| vim | 3 | 27.3% |
10.2.1. Chart (CCL adoption by teams)
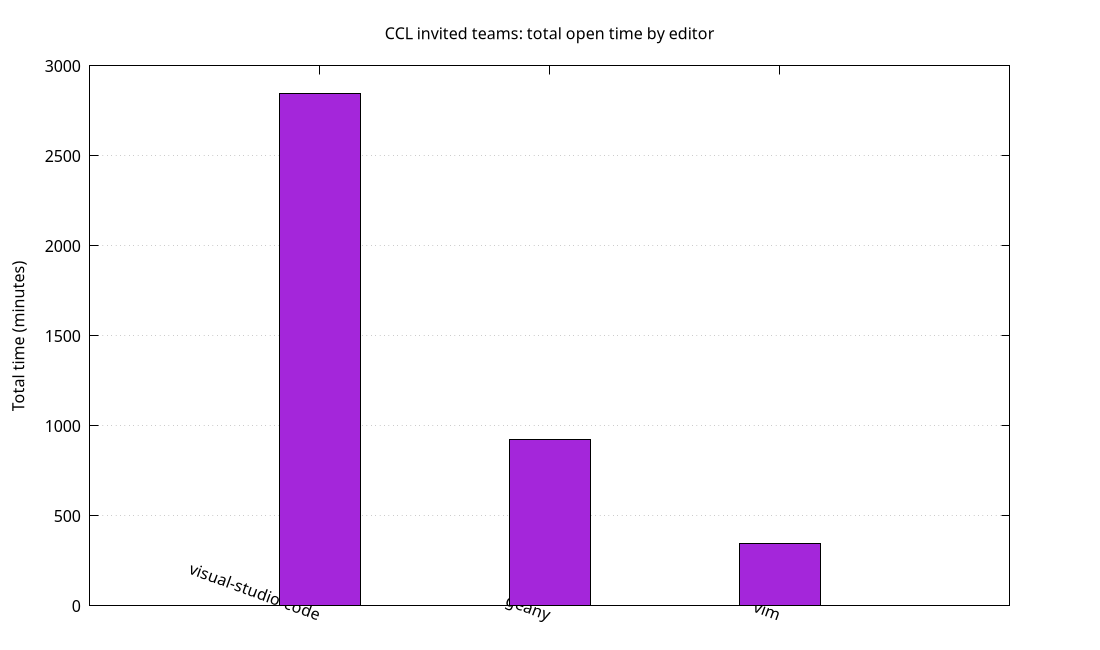
10.3. Editor usage totals (open time) within CCL (secondary view)
This does not change the main adoption-based conclusions, but it summarizes the total recorded open time per editor within CCL.
| Editor | Total open time (minutes) |
|---|---|
| visual-studio-code | 2846 |
| geany | 923 |
| vim | 349 |
10.3.1. Chart (CCL totals by minutes)
10.4. Editors used by the Top CCL teams (descriptive)
(Top CCL teams = ranks 1..3 in the provided CCL standings. Reported descriptively only; no performance implication.)
| CCL rank | Login | Team name | Editors used (>=60 min) |
|---|---|---|---|
| 1 | teamccl006 | [CCL] ivo yo te sigo | geany (317) |
| 2 | teamccl007 | [CCL] las4s e aposentados | visual-studio-code (315) |
| 3 | teamccl009 | [CCL] Necesitamos un Helicóptero Catastrófico | geany (315); visual-studio-code (316) |
10.5. CCL notes (non-causal)
- VS Code is the dominant choice among invited teams by adoption (81.8% of CCL teams).
- Geany and Vim appear as secondary options (each used by 27.3% of CCL teams).
- CCL results and tool choices are reported separately and are not comparable by region under the login-based region model.
11. Machines used by teams
All teams competed under the same hardware baseline:
- CPU: 12th Gen Intel(R) Core(TM) i5-12500
- Memory (RAM): 16 GB